Master support and resistance levels for crypto trading success. Learn to identify key levels, breakouts, and reversals using institutional-grade analysis tools and AI-powered insights.
Support and resistance levels are the foundation of technical analysis in crypto trading. These key price levels represent areas where buying and selling pressure converge, creating natural barriers that influence price movement. Understanding how to identify and trade these levels can significantly improve your trading performance and help you make more informed decisions.
In the volatile crypto market, support and resistance levels provide crucial reference points for entry, exit, and risk management decisions. These levels are not just arbitrary price points—they represent psychological barriers where market participants have historically shown strong buying or selling interest. Mastering support and resistance analysis can give you a significant edge in identifying high-probability trading opportunities.
This comprehensive guide will teach you how to master support and resistance analysis in crypto trading, from basic level identification to advanced institutional-grade techniques. We'll also explore how modern AI-powered platforms like SoroMM are revolutionizing support and resistance analysis with real-time level detection and pattern recognition.
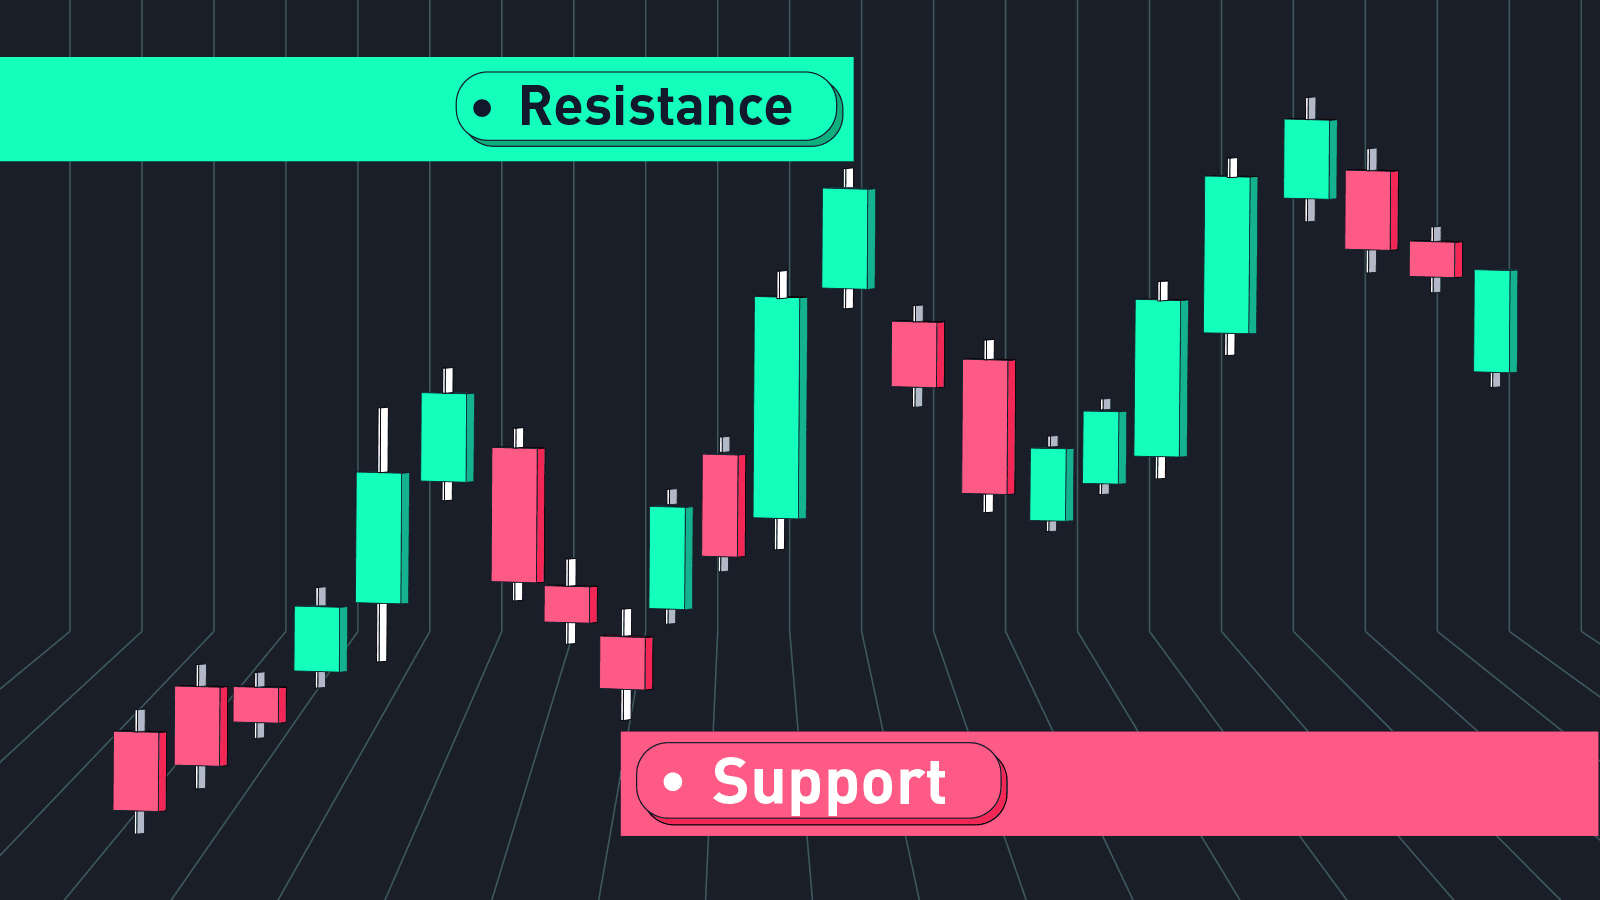
Support and resistance levels are price points where the market has historically shown strong buying or selling interest. These levels act as barriers that can either stop or reverse price movement, depending on the strength of the level and current market conditions.
Support Levels:
- **Definition:** Price levels where buying interest is strong enough to prevent further price declines
- **Characteristics:** Multiple touches, high volume on bounces, psychological significance
- **Psychology:** Areas where buyers believe the asset is undervalued
- **Behavior:** Price tends to bounce or reverse upward from support levels
Resistance Levels:
- **Definition:** Price levels where selling interest is strong enough to prevent further price advances
- **Characteristics:** Multiple touches, high volume on rejections, psychological significance
- **Psychology:** Areas where sellers believe the asset is overvalued
- **Behavior:** Price tends to bounce or reverse downward from resistance levels
Market Characteristics:
- **High Volatility:** Support/resistance provides stability in chaotic markets
- **24/7 Trading:** Continuous price action creates more level opportunities
- **Psychological Levels:** Round numbers and key price points matter
- **Institutional Activity:** Large players often use these levels for entries/exits
Trading Applications:
- **Entry Points:** Use levels for optimal entry timing
- **Exit Points:** Use levels for profit taking and stop losses
- **Risk Management:** Place stops beyond key levels
- **Position Sizing:** Adjust based on distance to levels
Historical Level Analysis:
- **Multiple Touches:** Look for levels that have been tested multiple times
- **Volume Confirmation:** High volume at level touches increases significance
- **Time Factor:** Levels that have held over longer periods are stronger
- **Price Action:** Sharp bounces or rejections indicate strong levels
Psychological Levels:
- **Round Numbers:** $10,000, $50,000, $100,000 for Bitcoin
- **Key Percentages:** 50%, 61.8% Fibonacci retracements
- **Previous Highs/Lows:** All-time highs, yearly highs, monthly highs
- **Moving Averages:** 50-day, 200-day moving averages
Strong Support/Resistance:
- **Multiple Touches:** Level tested 3+ times
- **High Volume:** Significant volume on bounces/rejections
- **Sharp Reactions:** Price moves quickly away from level
- **Time Tested:** Level has held over extended period
Weak Support/Resistance:
- **Few Touches:** Level tested only 1-2 times
- **Low Volume:** Minimal volume on bounces/rejections
- **Slow Reactions:** Price lingers near level
- **Recent Formation:** Level hasn't been tested over time
Breakout Trading:
- **Volume Confirmation:** High volume on breakout increases probability
- **Retest Entry:** Enter on pullback to broken resistance
- **Stop Loss:** Place stop below breakout level
- **Target:** Measure move equal to range height
Breakdown Trading:
- **Volume Confirmation:** High volume on breakdown increases probability
- **Retest Entry:** Enter on bounce to broken support
- **Stop Loss:** Place stop above breakdown level
- **Target:** Measure move equal to range height
While traditional support and resistance analysis relies on manual chart analysis and subjective interpretation, modern AI-powered platforms like SoroMM are revolutionizing how traders identify and trade these key levels. SoroMM's institutional-grade technology can detect support and resistance levels with precision and provide real-time alerts for potential breakouts and breakdowns.
SoroMM's advanced algorithms provide sophisticated support and resistance analysis:
Real-Time Level Identification:
- **Multi-Timeframe Analysis:** Identify levels across all timeframes
- **Volume Confirmation:** AI confirms levels with volume analysis
- **Pattern Recognition:** Detect complex support/resistance formations
- **Strength Assessment:** Automatically rate level strength
Institutional-Grade Tools for Every Trader:
- **Professional Level Analysis:** Access institutional-level support/resistance analysis
- **Automated Detection:** AI identifies levels automatically
- **Real-Time Alerts:** Instant notifications for level breaks
- **Historical Analysis:** Learn from past level performance
Dynamic Level Updates:
- **Real-Time Adjustments:** Levels update as market conditions change
- **Volume Weighting:** AI weighs levels based on volume significance
- **Time Decay:** Older levels lose significance over time
- **Market Context:** Adjusts levels based on overall market conditions
Level-Based Signal Generation:
- **Breakout Alerts:** Notify when levels are broken
- **Retest Opportunities:** Identify optimal entry points
- **Risk Management:** Suggest stop loss placement
- **Target Projections:** Calculate potential price targets
The platform's 74% win rate is achieved through superior support and resistance analysis that helps traders identify high-probability setups and avoid false breakouts that plague traditional level analysis.
To illustrate how support and resistance analysis works in practice, let's examine how SoroMM's AI-powered platform applies these principles to real market conditions. The platform's ability to process vast amounts of data in real-time allows it to identify levels that traditional analysis might miss.
**Scenario:** Bitcoin approaches major support at $40,000
**Traditional Analysis:** Manual level identification, subjective interpretation
**SoroMM AI Analysis:** Automated level detection, volume confirmation
Results:
- **Level Confirmation:** AI confirmed strong support with volume analysis
- **Entry Signal:** AI provided optimal entry near support level
- **Risk Management:** Suggested stop loss below support
- **Target Projection:** Calculated potential upside targets
- **Outcome:** 15% profit within 1 week
**Scenario:** Ethereum breaks above resistance at $3,000
**Traditional Analysis:** Breakout identified after fact
**SoroMM AI Analysis:** Early detection, volume confirmation
Results:
- **Early Detection:** AI identified potential breakout before price action
- **Volume Confirmation:** High volume confirmed genuine breakout
- **Entry Signal:** AI provided entry on retest of broken resistance
- **Target Achievement:** Price reached projected target levels
- **Outcome:** 20% profit within 2 weeks
As markets become more complex and institutional activity increases, the edge in support and resistance analysis comes from:
- **Real-time level detection** using AI and machine learning
- **Volume-weighted analysis** for more accurate level assessment
- **Multi-timeframe confirmation** for stronger signals
- **Automated signal generation** based on level interactions
SoroMM represents the next evolution in support and resistance analysis, combining traditional level theory with AI-powered insights to provide traders with institutional-grade tools previously available only to professional trading firms.
Moving Support/Resistance:
- **Trending Markets:** Support/resistance levels that move with trend
- **Moving Averages:** Use key moving averages as dynamic levels
- **Trend Lines:** Draw trend lines for dynamic support/resistance
- **Adaptation:** Adjust levels based on market conditions
Confluence Zones:
- **Multiple Levels:** Areas where multiple support/resistance levels converge
- **Increased Significance:** Confluence zones are stronger than single levels
- **Entry Opportunities:** Use confluence for high-probability entries
- **Risk Management:** Place stops beyond confluence zones
Smart Money Levels:
- **Institutional Activity:** Identify levels where institutions trade
- **Volume Analysis:** High volume at levels indicates institutional interest
- **Order Flow:** Large orders often cluster at key levels
- **Behavior Patterns:** Institutions often use same levels repeatedly
Level Manipulation:
- **Stop Hunting:** Large players may push price beyond levels to trigger stops
- **Fake Breakouts:** Temporary breaks of levels to trap retail traders
- **Volume Analysis:** Use volume to distinguish real vs fake breaks
- **Patience:** Wait for confirmation before trading level breaks
Position Sizing:
- **Distance to Level:** Adjust position size based on distance to next level
- **Level Strength:** Larger positions at stronger levels
- **Market Conditions:** Reduce size during high volatility
- **Risk Tolerance:** Personal risk tolerance affects position sizing
Stop Loss Placement:
- **Beyond Levels:** Place stops beyond key support/resistance levels
- **Buffer Zone:** Add small buffer beyond level for safety
- **Volatility Adjustment:** Adjust buffer based on market volatility
- **Multiple Stops:** Use multiple stop levels for larger positions
Support and resistance analysis is a fundamental skill that every crypto trader should master. These key levels provide crucial reference points for trading decisions and can significantly improve your trading performance when used correctly.
1. **Support and resistance levels are psychological barriers** - They represent areas of strong buying/selling interest
2. **Volume confirms level strength** - High volume at levels increases significance
3. **Multiple touches increase level strength** - Levels tested multiple times are stronger
4. **Breakouts require volume confirmation** - Always confirm breakouts with volume
5. **Use levels for risk management** - Place stops beyond key levels
6. **Leverage AI-powered tools** - Use institutional-grade level analysis
1. **Study historical levels** - Analyze past support/resistance levels
2. **Practice level identification** - Mark levels on your charts
3. **Develop level-based strategies** - Create specific approaches using levels
4. **Use institutional-grade tools** - Leverage AI-powered platforms like SoroMM
5. **Track your level analysis** - Monitor how level trading improves results
6. **Stay disciplined** - Stick to your level-based rules
- **Books:** "Technical Analysis of Stock Trends" by Edwards and Magee
- **Courses:** Support and resistance analysis courses
- **Practice:** Use trading simulators to practice level trading
- **Community:** Join trading communities focused on technical analysis
- **Tools:** Explore AI-powered platforms for enhanced level analysis
Remember, support and resistance analysis is not about predicting exact price levels but about identifying areas where the market is likely to react. The most successful traders are those who combine level analysis with other forms of technical analysis and maintain strict risk management.
---
**Ready to master support and resistance with institutional-grade tools?** Discover how SoroMM's AI-powered platform can enhance your level analysis with real-time detection and advanced pattern recognition. Join thousands of traders who are already using AI technology to identify high-probability trading opportunities through superior support and resistance analysis.